
About this resource
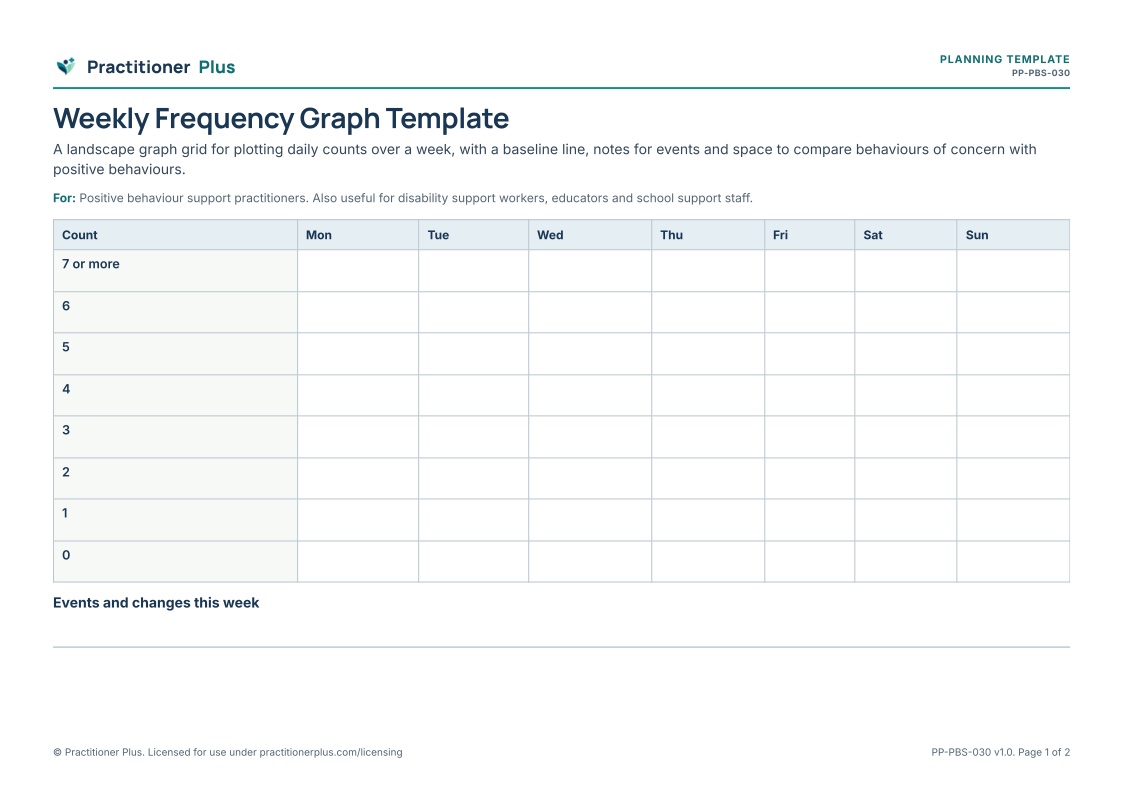
Graphs show patterns quickly. This grid lets teams plot daily counts across a week, mark the baseline, note events that might explain changes and compare behaviours of concern with positive behaviours.
Purpose
To make patterns in frequency data easy to see.
Who it is for
Primary profession: Positive behaviour support practitioners. Also relevant for disability support workers, educators and school support staff.
Client or participant group: Teams and practitioners graphing behaviour data.
Practice setting: Behaviour support data review.
Suggested uses
- Data review meetings
- Sharing data with families
- Reviewing strategies
- Training teams in data use
Instructions for practitioners
- Agree the scale before plotting.
- Mark the baseline average.
- Note events and changes under the graph.
- Discuss patterns with the team.
Accessibility considerations
Use different line styles, not only colours, for different behaviours.
Scope and limitations
A data display tool. It does not determine the function of behaviour.
Research basis
Understanding what happens before and after behaviour is the basis of functional assessment, which guides support.
- Hanley, G. P., Iwata, B. A., & McCord, B. E. (2003). FUNCTIONAL ANALYSIS OF PROBLEM BEHAVIOR: A REVIEW. Journal of Applied Behavior Analysis, 36(2), 147–185. https://doi.org/10.1901/jaba.2003.36-147
What is included
A 2-page printable A4 PDF, including a practitioner notes page with the research basis (version 1.0).
Originality
Original Practitioner Plus content: wording, activity structure, layout and icons were created for this resource. No third-party worksheets, illustrations or text were reproduced.


